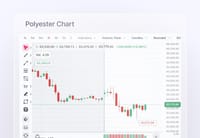
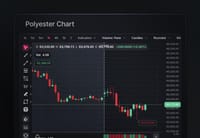
The TradingView Chart is an alternative charting surface for Polyester market data. Use it when you prefer TradingView Advanced Charts, indicators, drawing tools, and chart controls.
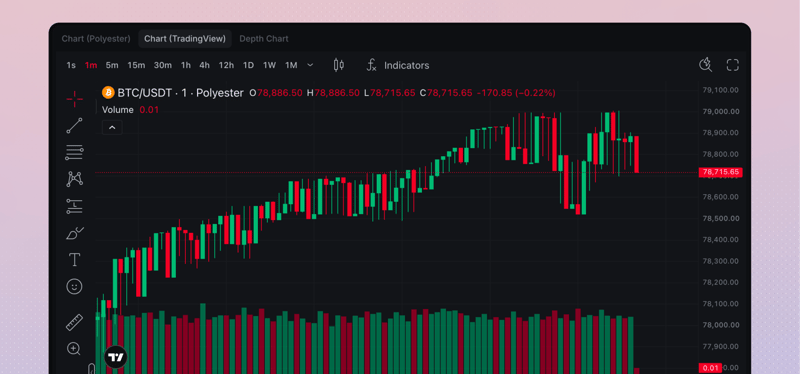
Chart settings and market context
TradingView changes how the market is displayed and analyzed. It does not change how Polyester admits, matches, or settles an order.
Before using the chart for a decision, confirm:
- the active Polyester Pair matches the chart symbol
- the interval and chart style fit the question you are asking
- the latest candle time is current
- saved indicators or drawings are the ones you intended to load.
Available tools can vary with the embedded chart configuration. The controls visible in the current widget are the source of truth.
Move from analysis to an order
A chart can help you choose an intended price or condition. The Order Form defines the instruction Polyester receives.
Use the Order Book for current displayed liquidity and Market Trades for recent public executions. Use account order and fill records to confirm your own result.