Market Trades is the live tape for the active Pair. Each row is a completed public execution, not a resting order or an unactivated trigger.
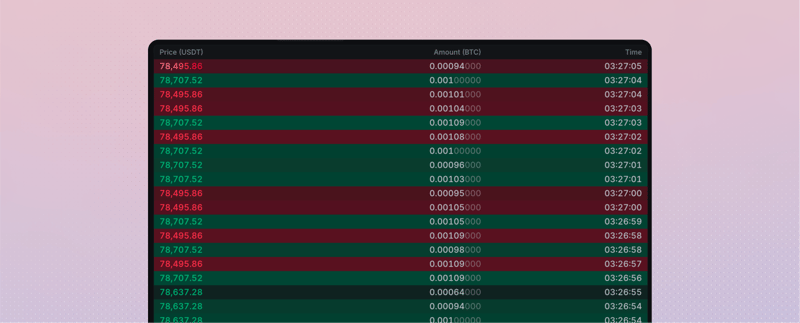
What the widget shows
| Field | What it means |
|---|---|
| Price | Price where the trade completed |
| Amount | Executed amount in the selected base or quote Asset unit |
| Time | Time the public execution was reported |
| Color | Displayed buy or sell direction for the trade print |
The widget can show Amount in the base or quote Asset. Its volume threshold can also emphasize larger trades without removing the underlying executions from the market record.
Read recent activity
Market Trades shows where price discovery is happening and whether recent activity is clustered around a level. Compare it with the Polyester Chart for history and the Order Book for liquidity that is resting now.
Public trades are not private fill history
A row does not identify either participant or prove that the selected account took part. Use Order History and fill details to confirm account activity, fees, and balance changes.
If the tape looks stale
Confirm the active Pair, latest timestamp, and connection state. Refresh the widget after a connection gap, then verify your own order independently in Order History.
Related Topics
Polyester Chart Read candles, volume, indicators, and drawings in Polyester's native market chart. Order Book Read current buy and sell prices, the spread, and visible liquidity for one spot market. Order History Review filled, canceled, expired, and rejected order outcomes for the selected account.