The Depth Chart turns the Order Book into two cumulative curves. Use it to see how visible liquidity is distributed around the spread before choosing an order size or price.
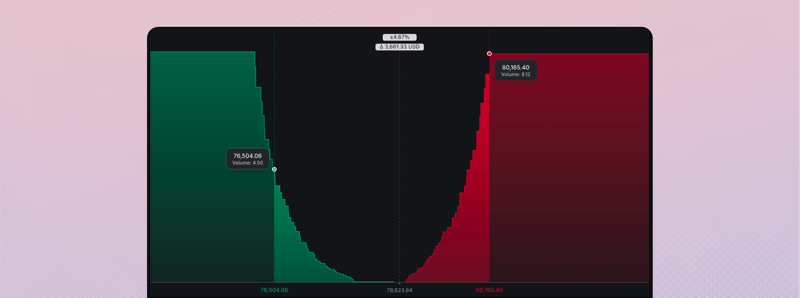
What the widget shows
| Element | What it means |
|---|---|
| Buy depth | Cumulative displayed buy quantity up to each price |
| Sell depth | Cumulative displayed sell quantity up to each price |
| Horizontal position | How far a price is from the center of the market |
| Vertical height | How much visible quantity has accumulated by that price |
| Center gap | The area between the best visible buy and sell prices |
Hover over a curve to inspect its price and cumulative amount. A steep section means more displayed quantity is concentrated in a smaller price range.
Use it with the Order Book
The Depth Chart and Order Book describe the same visible liquidity in different ways. Use the chart to understand shape and concentration. Use the Order Book when you need exact prices, amounts, and cumulative totals.
Confirm the chart is current
Confirm the active Pair and connection state before relying on the curves. After a disconnect, wait for the widget to rebuild from a fresh Order Book snapshot rather than treating the first new update as a complete view.