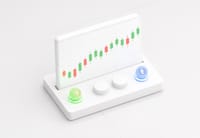
The Polyester Chart is the native chart built in-house for the Trading Screen. It combines historical candles, the current candle, volume, and analysis tools for the active Pair.
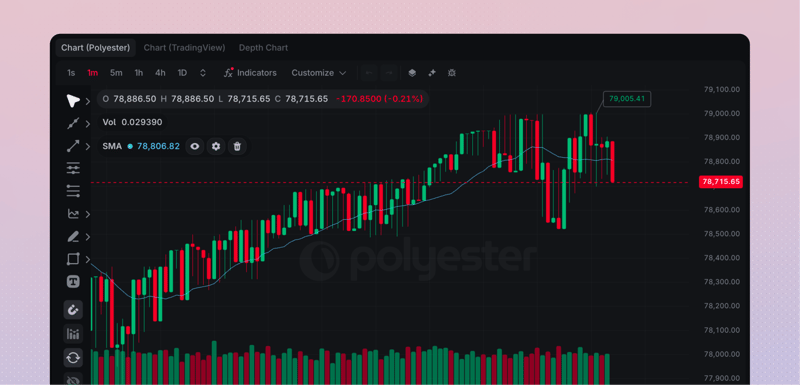
What the widget shows
Each candle summarizes completed trades during one interval.
| Value | What it means |
|---|---|
| Open | First execution price in the interval |
| High | Highest execution price in the interval |
| Low | Lowest execution price in the interval |
| Close | Latest or final execution price in the interval |
| Volume | Quantity executed during the interval |
The current candle can change as new trades arrive. Earlier candles represent completed intervals.
Choose a chart interval
Select an interval that matches the move you want to study. Short intervals reveal more immediate activity and noise. Longer intervals compress short moves and make broader price structure easier to see.
The current candle service supports 1 second, 1 minute, 5 minute, 15 minute, 30 minute, 1 hour, 4 hour, 12 hour, 1 day, 1 week, and 1 calendar month intervals. A history request returns 500 candles by default and at most 10,000, with time bounds and pagination for older data. Polyester does not publish a guaranteed candle-retention period.
Customize the chart's theme and appearance, then add the indicators, drawings, and chart layers that support the analysis. These controls do not place an order, reserve a balance, or create a trigger.
Charts show public trades, not account activity
Candles are built from public completed trades. Use Open Orders and Order History to confirm activity attributed to the selected account.